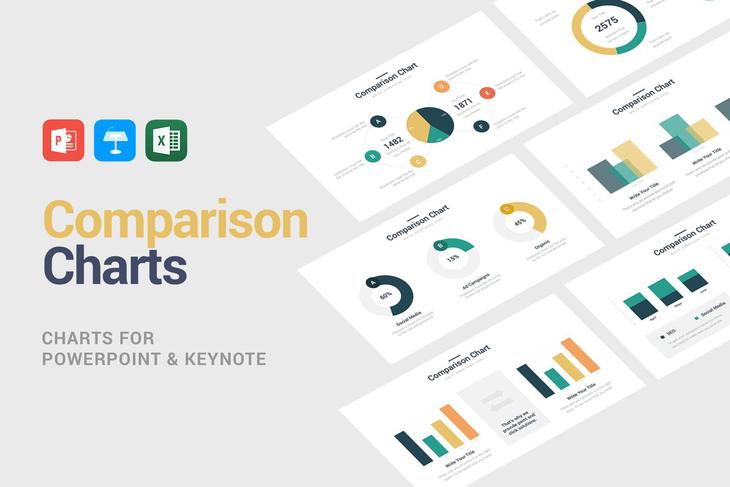


Description
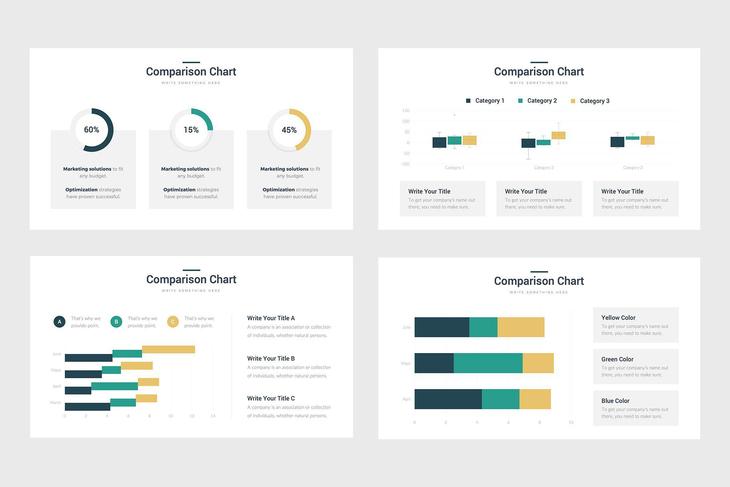
As you present differences between products or other concepts, whether it be as a business owner, product creator, manager, or other position, it’s important to do so in a way that is informative yet appealing to your audience. With the help of the Comparison Charts infographics, you will be able to conduct product comparisons, examine consumer behavior, and so much more in just a single slide.
Product comparisons are important to make because doing so will help you to understand what features people appreciated in one product versus the other. In addition, it will allow you to see areas in which you as a business owner or manager can improve, what needs to be improved in your products, and, in general, where you need to focus your marketing strategy. This is a great way for your team’s marketing specialists to remain informed about the task at hand and what is expected of them.
Aside from product comparisons, it also will be necessary to examine consumer behavior. This means that you will be able to see how your consumers respond to your products, what they appreciate, and where your target audience is.
Understanding these two factors will help you to enhance and improve your business. With the help of our infographics, you will be able to create a comparison chart in one single slide that covers all the important information in a way that will capture your audience’s interest. You only need to focus on the most critical information, which means that you can spend more time devoted to improvements where necessary.
Features:
- PowerPoint Files
- Apple Keynote Files
- Charts linked to Excel
- 16:9 HD Aspect Ratio
- All Graphic Resizable and Editable