
Description
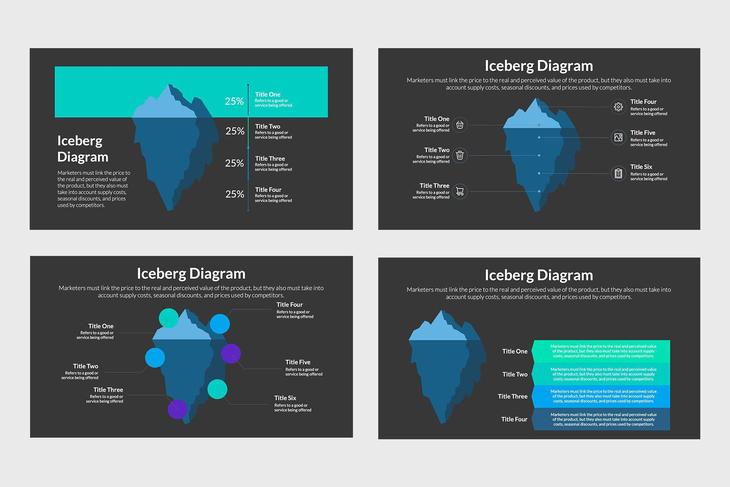
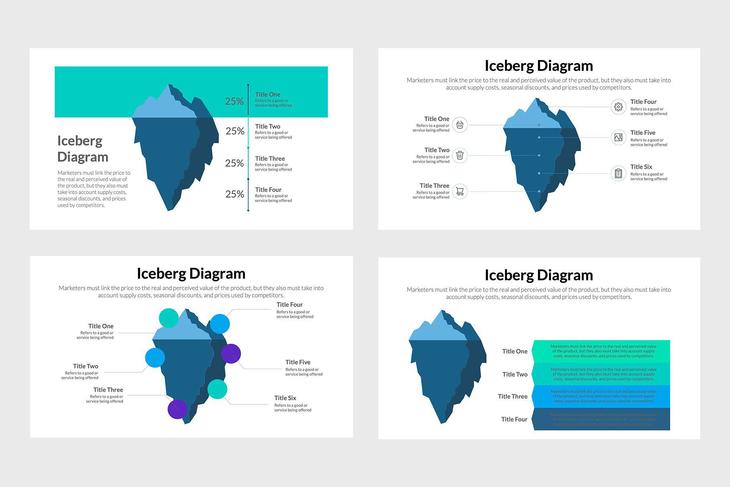
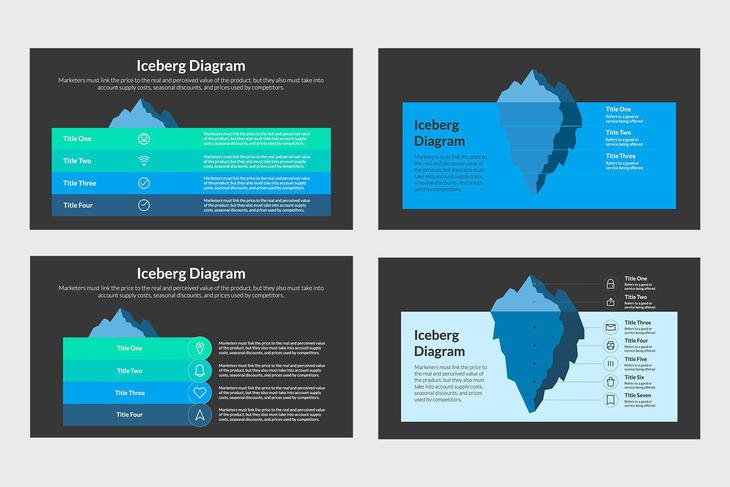
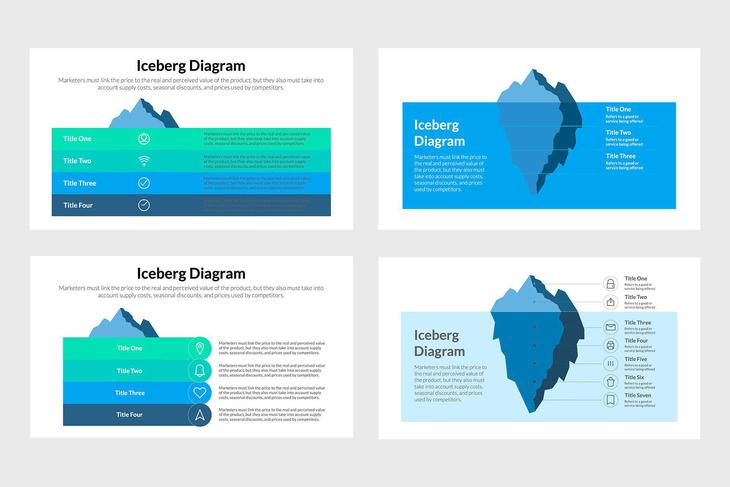
An iceberg diagram is a multipurpose infographic that helps you to point out all the factors that are affecting your company. For instance, one of the information you can present in Iceberg Infographics is going to help you show the most obvious factors right at the top of the iceberg. Also, present those factors that are behind scenes right at the bottom of it. Its hierarchy design will allow you to show from the most important concepts to the least. Only copy the information you want to present to your colleagues and paste it into the diagram you like the best. Each one of these infographics is completely editable which means that you can make it yours in on time.
Features:
- PowerPoint Files
- 130+ Free Theme Colors
- Apple Keynote Files
- Google Slides Files
- Adobe Illustrator Files
- 16:9 HD Aspect Ratio
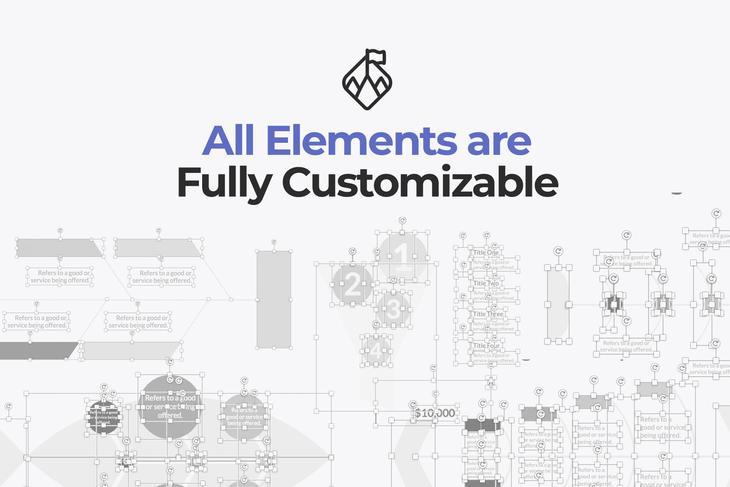
- All Graphic Resizable and Editable